Spectre and Meltdown took much of our community by surprise. I personally found these attacks fascinating because they didn't rely on a bug in any particular hardware implementation, but leveraged undefined behavior. Specifically, Spectre and Meltdown can exfiltrate potentially secret memory data by detecting the effects of speculative instructions that are later squashed.
Very cool!
Out of order processors are very complex. It would make it easier to understand exactly what causes speculation attacks like Spectre and Meltdown if we had a way to visualize the attacks. Luckily, gem5 already has a way to view the details of it's out of order CPU's pipeline.
o3 pipeline view example
The image above was created using the O3 pipeline viewer that is included with gem5. In this post, I'll explain how to use the O3 pipeline viewer and how to generate images like the above. There is also a new project which makes it easier to navigate large pipeline traces and it quite useful for comparing different pipeline designs: Konata created by Ryota Shioya. Ryota gave a presentation on Konata at a recent Learning gem5 tutorial. You can find the pdf of his presentation here. Konata is a cool tool that's written in javascript and Ryota describes it as "Google maps for an out of order pipeline".
Running Spectre
The first step to visualizing what is going on in the pipeline during a Spectre attack is getting proof of concept exploit code. I used the code that was posted to a github gist by Erik August soon after the attack was announced. You can get that code here: https://gist.github.com/ErikAugust/724d4a969fb2c6ae1bbd7b2a9e3d4bb6.
First, you need to compile the proof of concept code on your native machine (note: I'll be using x86 for all of my examples).
gcc spectre.c -o spectre -static
I used gcc 7.2 (the default on Ubuntu 17.10) for my tests, and you may want to do the same. Below I discuss the effects different compilers have on the Specre attack. For instance, if you use clang instead you may not be able to reproduce the Spectre attack in gem5.
docker run --rm -v $PWD:$PWD -w $PWD powerjg/gem5-build-gcc48 gcc spectre.c -o spectre -static -std=c99
My native machine is still vulnerable to Spectre so when I run the binary generated above, I get the following output.
Reading 40 bytes:
Reading at malicious_x = 0xffffffffffdd76c8... Success: 0x54=’T’ score=2
Reading at malicious_x = 0xffffffffffdd76c9... Success: 0x68=’h’ score=2
Reading at malicious_x = 0xffffffffffdd76ca... Success: 0x65=’e’ score=2
Reading at malicious_x = 0xffffffffffdd76cb... Success: 0x20=’ ’ score=2
Reading at malicious_x = 0xffffffffffdd76cc... Success: 0x4D=’M’ score=2
Reading at malicious_x = 0xffffffffffdd76cd... Success: 0x61=’a’ score=2
Reading at malicious_x = 0xffffffffffdd76ce... Success: 0x67=’g’ score=2
Reading at malicious_x = 0xffffffffffdd76cf... Success: 0x69=’i’ score=2
Reading at malicious_x = 0xffffffffffdd76d0... Success: 0x63=’c’ score=2
Reading at malicious_x = 0xffffffffffdd76d1... Success: 0x20=’ ’ score=2
Reading at malicious_x = 0xffffffffffdd76d2... Success: 0x57=’W’ score=2
Reading at malicious_x = 0xffffffffffdd76d3... Success: 0x6F=’o’ score=2
Reading at malicious_x = 0xffffffffffdd76d4... Success: 0x72=’r’ score=2
Reading at malicious_x = 0xffffffffffdd76d5... Success: 0x64=’d’ score=2
Reading at malicious_x = 0xffffffffffdd76d6... Success: 0x73=’s’ score=2
Reading at malicious_x = 0xffffffffffdd76d7... Success: 0x20=’ ’ score=2
Reading at malicious_x = 0xffffffffffdd76d8... Success: 0x61=’a’ score=2
Reading at malicious_x = 0xffffffffffdd76d9... Success: 0x72=’r’ score=2
Reading at malicious_x = 0xffffffffffdd76da... Success: 0x65=’e’ score=2
Reading at malicious_x = 0xffffffffffdd76db... Success: 0x20=’ ’ score=2
Reading at malicious_x = 0xffffffffffdd76dc... Success: 0x53=’S’ score=2
Reading at malicious_x = 0xffffffffffdd76dd... Success: 0x71=’q’ score=2
Reading at malicious_x = 0xffffffffffdd76de... Success: 0x75=’u’ score=2
Reading at malicious_x = 0xffffffffffdd76df... Success: 0x65=’e’ score=2
Reading at malicious_x = 0xffffffffffdd76e0... Success: 0x61=’a’ score=2
Reading at malicious_x = 0xffffffffffdd76e1... Success: 0x6D=’m’ score=2
Reading at malicious_x = 0xffffffffffdd76e2... Success: 0x69=’i’ score=2
Reading at malicious_x = 0xffffffffffdd76e3... Success: 0x73=’s’ score=2
Reading at malicious_x = 0xffffffffffdd76e4... Success: 0x68=’h’ score=2
Reading at malicious_x = 0xffffffffffdd76e5... Success: 0x20=’ ’ score=2
Reading at malicious_x = 0xffffffffffdd76e6... Success: 0x50=’P’ score=9 (second best: 0x06 score=2)
Reading at malicious_x = 0xffffffffffdd76e7... Success: 0x73=’s’ score=2
Reading at malicious_x = 0xffffffffffdd76e8... Success: 0x73=’s’ score=2
Reading at malicious_x = 0xffffffffffdd76e9... Success: 0x69=’i’ score=2
Reading at malicious_x = 0xffffffffffdd76ea... Success: 0x66=’f’ score=2
Reading at malicious_x = 0xffffffffffdd76eb... Success: 0x72=’r’ score=2
Reading at malicious_x = 0xffffffffffdd76ec... Success: 0x61=’a’ score=2
Reading at malicious_x = 0xffffffffffdd76ed... Success: 0x67=’g’ score=2
Reading at malicious_x = 0xffffffffffdd76ee... Success: 0x65=’e’ score=2
Reading at malicious_x = 0xffffffffffdd76ef... Success: 0x2E=’.’ score=2
Running Spectre in gem5
To find out if gem5's out of order CPU implementation is vulnerable to Spectre, we need to run the code in gem5. The simplest and fastest way to do this is by running in gem5's syscall-emulation (SE) mode. In SE mode we won't be modeling an OS or any user-mode to kernel-mode interaction, but this okay for Spectre since this proof of concept code is all in user-mode. If we were investigating Metldown, we would have to use full-system (FS) mode since Meltdown specifically allows user-mode processes to read data that should only be accessible in kernel mode.
So, when running something in gem5, the first step is to create a Python runscript since this is the "interface" to gem5. For this example, what we need is a system with one CPU, an L1 cache, and memory. For simplicity, I'm going to modify one of the existing script, specifically the two_level.py script from the Learning gem5 book.
In the file gem5/configs/learning_gem5/part1/two_level.py, I simply changed the CPU from TimingSimpleCPU() to DerivO3CPU(branchPred=LTAGE()). I also set the O3CPU to use the LTAGE branch predictor instead of the default tournament branch predictor. It's important to use the LTAGE branch predictor as better branch predictors actually make Spectre easier to exploit as discussed further below.
Now, we simply need to build gem5 and run it.
scons -j8 build/X86/gem5.opt

build/X86/gem5.opt configs/learning_gem5/part1/two_level.py spectre
And, the output that I get is the following, just like above when I ran the spectre natively. Note: If you use GCC 4.8 it executes much faster than 7.2 (the default on Ubuntu 17.10).
gem5 Simulator System.  http://gem5.org
gem5 is copyrighted software; use the --copyright option for details.

gem5 compiled May 10 2018 09:40:08
gem5 started May 24 2018 11:21:16
gem5 executing on palisade, pid 27173
command line: build/X86/gem5.opt configs/learning_gem5/part1/two_level.py spectre

Global frequency set at 1000000000000 ticks per second
warn: DRAM device capacity (8192 Mbytes) does not match the address range assigned (512 Mbytes)
0: system.remote_gdb: listening for remote gdb on port 7000
Beginning simulation!
info: Entering event queue @ 0.  Starting simulation...
warn: readlink() called on '/proc/self/exe' may yield unexpected results in various settings.
      Returning '/home/jlp/Code/gem5/spectre-vis/spectre'
info: Increasing stack size by one page.
warn: ignoring syscall access(...)
Reading 40 bytes:                 tput cols
Reading at malicious_x = 0xffffffffffdd76c8... Success: 0x54=’T’ score=2
Reading at malicious_x = 0xffffffffffdd76c9... Success: 0x68=’h’ score=2
Reading at malicious_x = 0xffffffffffdd76ca... Success: 0x65=’e’ score=2
Reading at malicious_x = 0xffffffffffdd76cb... Success: 0x20=’ ’ score=2
Reading at malicious_x = 0xffffffffffdd76cc... Success: 0x4D=’M’ score=2
Reading at malicious_x = 0xffffffffffdd76cd... Success: 0x61=’a’ score=2
Reading at malicious_x = 0xffffffffffdd76ce... Success: 0x67=’g’ score=2
Reading at malicious_x = 0xffffffffffdd76cf... Success: 0x69=’i’ score=2
Reading at malicious_x = 0xffffffffffdd76d0... Success: 0x63=’c’ score=2
Reading at malicious_x = 0xffffffffffdd76d1... Success: 0x20=’ ’ score=2
Reading at malicious_x = 0xffffffffffdd76d2... Success: 0x57=’W’ score=2
Reading at malicious_x = 0xffffffffffdd76d3... Success: 0x6F=’o’ score=2
Reading at malicious_x = 0xffffffffffdd76d4... Success: 0x72=’r’ score=2
Reading at malicious_x = 0xffffffffffdd76d5... Success: 0x64=’d’ score=2
Reading at malicious_x = 0xffffffffffdd76d6... Success: 0x73=’s’ score=2
Reading at malicious_x = 0xffffffffffdd76d7... Success: 0x20=’ ’ score=2
Reading at malicious_x = 0xffffffffffdd76d8... Success: 0x61=’a’ score=2
Reading at malicious_x = 0xffffffffffdd76d9... Success: 0x72=’r’ score=2
Reading at malicious_x = 0xffffffffffdd76da... Success: 0x65=’e’ score=2
Reading at malicious_x = 0xffffffffffdd76db... Success: 0x20=’ ’ score=2
Reading at malicious_x = 0xffffffffffdd76dc... Success: 0x53=’S’ score=2
Reading at malicious_x = 0xffffffffffdd76dd... Success: 0x71=’q’ score=2
Reading at malicious_x = 0xffffffffffdd76de... Success: 0x75=’u’ score=2
Reading at malicious_x = 0xffffffffffdd76df... Success: 0x65=’e’ score=2
Reading at malicious_x = 0xffffffffffdd76e0... Success: 0x61=’a’ score=2
Reading at malicious_x = 0xffffffffffdd76e1... Success: 0x6D=’m’ score=2
Reading at malicious_x = 0xffffffffffdd76e2... Success: 0x69=’i’ score=2
Reading at malicious_x = 0xffffffffffdd76e3... Success: 0x73=’s’ score=2
Reading at malicious_x = 0xffffffffffdd76e4... Success: 0x68=’h’ score=2
Reading at malicious_x = 0xffffffffffdd76e5... Success: 0x20=’ ’ score=2
Reading at malicious_x = 0xffffffffffdd76e6... Success: 0x4F=’O’ score=2
Reading at malicious_x = 0xffffffffffdd76e7... Success: 0x73=’s’ score=2
Reading at malicious_x = 0xffffffffffdd76e8... Success: 0x73=’s’ score=2
Reading at malicious_x = 0xffffffffffdd76e9... Success: 0x69=’i’ score=2
Reading at malicious_x = 0xffffffffffdd76ea... Success: 0x66=’f’ score=2
Reading at malicious_x = 0xffffffffffdd76eb... Success: 0x72=’r’ score=2
Reading at malicious_x = 0xffffffffffdd76ec... Success: 0x61=’a’ score=2
Reading at malicious_x = 0xffffffffffdd76ed... Success: 0x67=’g’ score=2
Reading at malicious_x = 0xffffffffffdd76ee... Success: 0x65=’e’ score=2
Reading at malicious_x = 0xffffffffffdd76ef... Success: 0x2E=’.’ score=2
Exiting @ tick 113568969000 because exiting with last active thread context
Visualizing the out of order pipeline
To generate pipeline visualizations, we first need to generate a trace file of all of the instructions executed by the out of order CPU. To create this trace, we can use the O3PipeView debug flag.
Now, the trace for the O3 CPU can be very large up to many GBs. When creating this trace, you need to be careful to create the smallest trace possible. Also, it's important to dump the trace to a file and not to stdout, which is the default when using debug flags. You can redirect the trace to a file by using the --debug-file option to gem5.
To create the trace file, I used the following methodology:
- Start running spectre in gem5, then hit ctrl-c after the first couple of letters. At this point, I wrote down the tick which gem5 exited (13062347000).
- Run gem5 with the debug flag O3PipeView enabled.
- Watch the output and kill gem5 with ctrl-c after two more letters appeared than in step 1.
To generate the trace, I ran the following command. Note: you may have a different value for when to start the debugging trace. Also note: when producing the trace gem5 will run much slower.
build/X86/gem5.opt --debug-flags=O3PipeView --debug-file=pipeview.txt --debug-start=13062347000 configs/learning_gem5/part1/two_level.py spectre
My tracefile (pipeview.txt) was 600 MB for catching just two letters in the output.
Now, we can process this file to generate the visualization with a script: util/o3-pipeview.py. This script requires the path to the file that contains the output generated with the O3PipeView debug flag. Above, we put the output into the file pipeview.txt, and this file was created in the default output directory of gem5 (m5out/).
util/o3-pipeview.py --store_completions m5out/pipeview.txt --color -w 150
In the above command, I wanted to see when the stores completed (--store_completions) and specified to use color (--color) in the output and use a width of 150 characters (-w 150). Processing a large file like this one of 600 MB may take a few minutes. The output will be in a file called o3-pipeview.out in the current working directory.
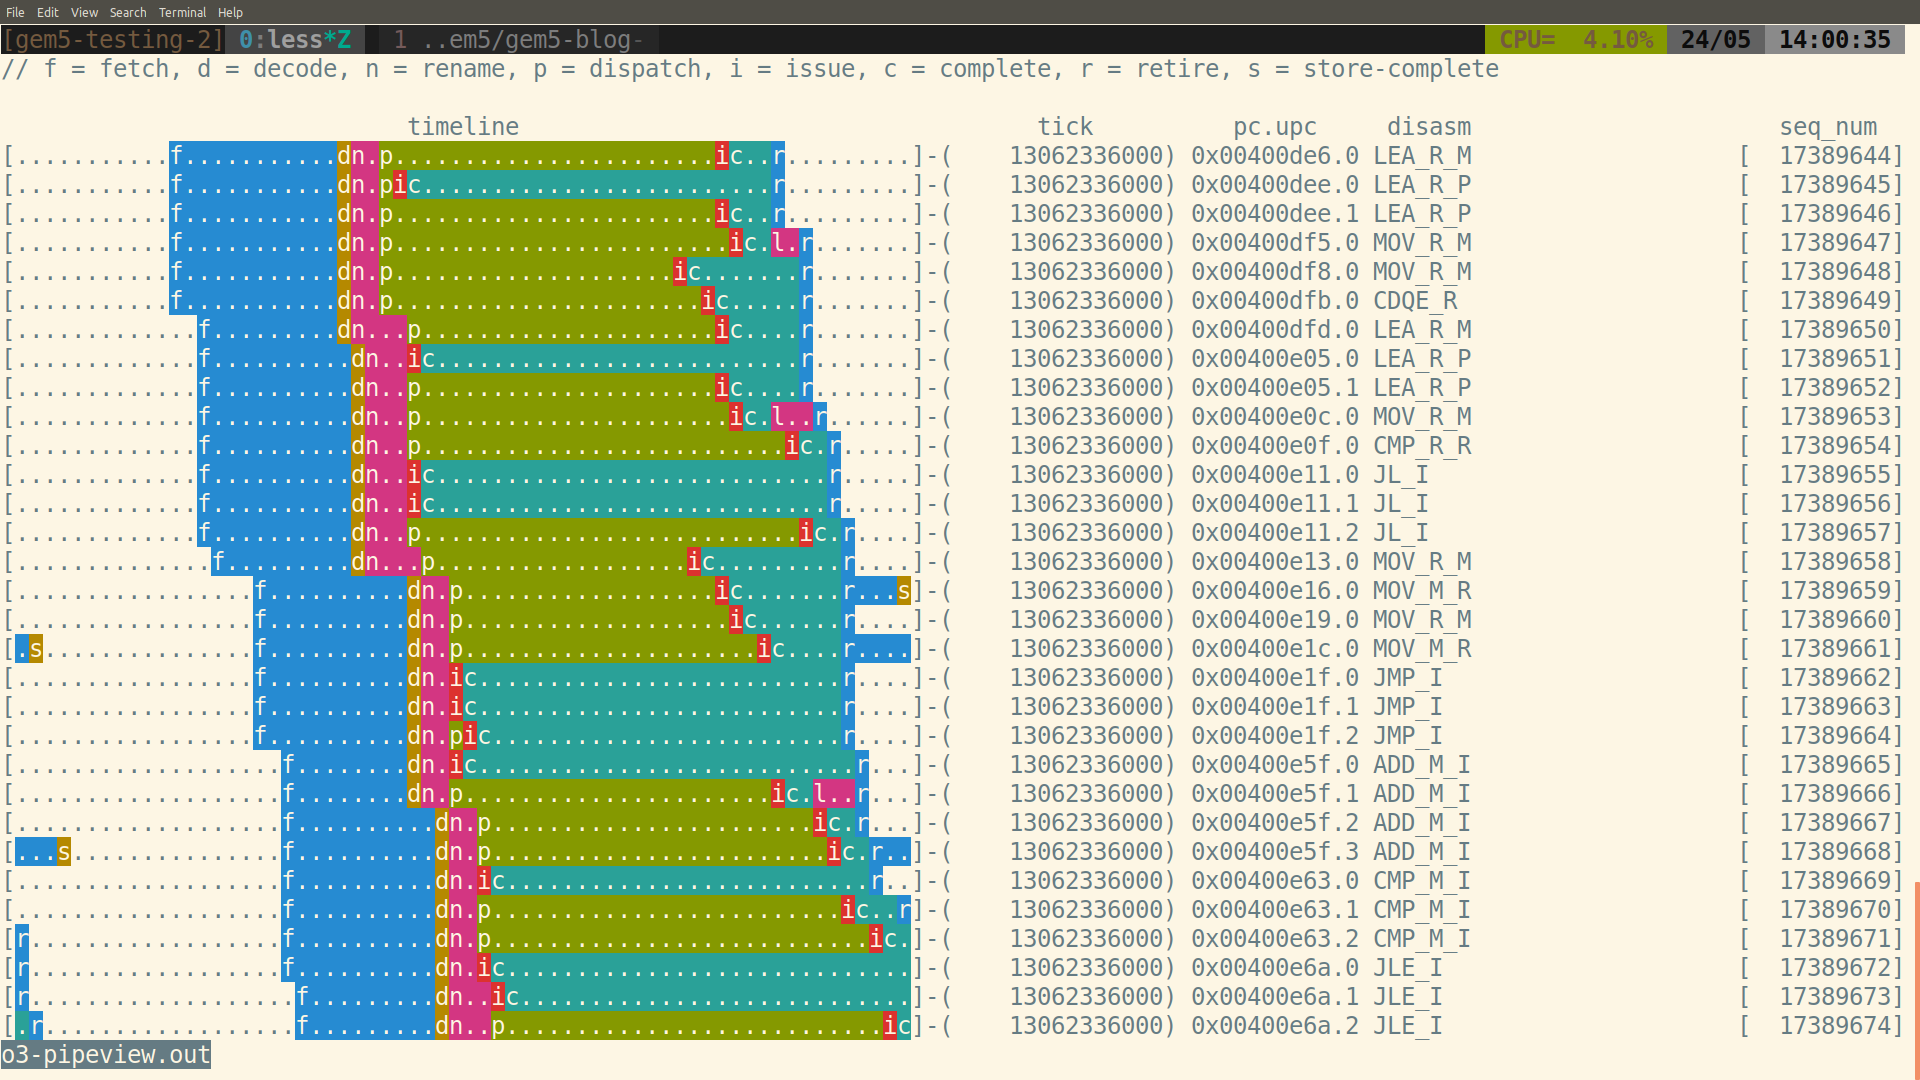
You can view this file with less -r o3-pipeview.out. You may want to use the -S option with less if your terminal is less than 150 characters wide (or whatever width value you used). Below is a screenshot of the top of my trace.
Understanding the O3 pipeline viewer
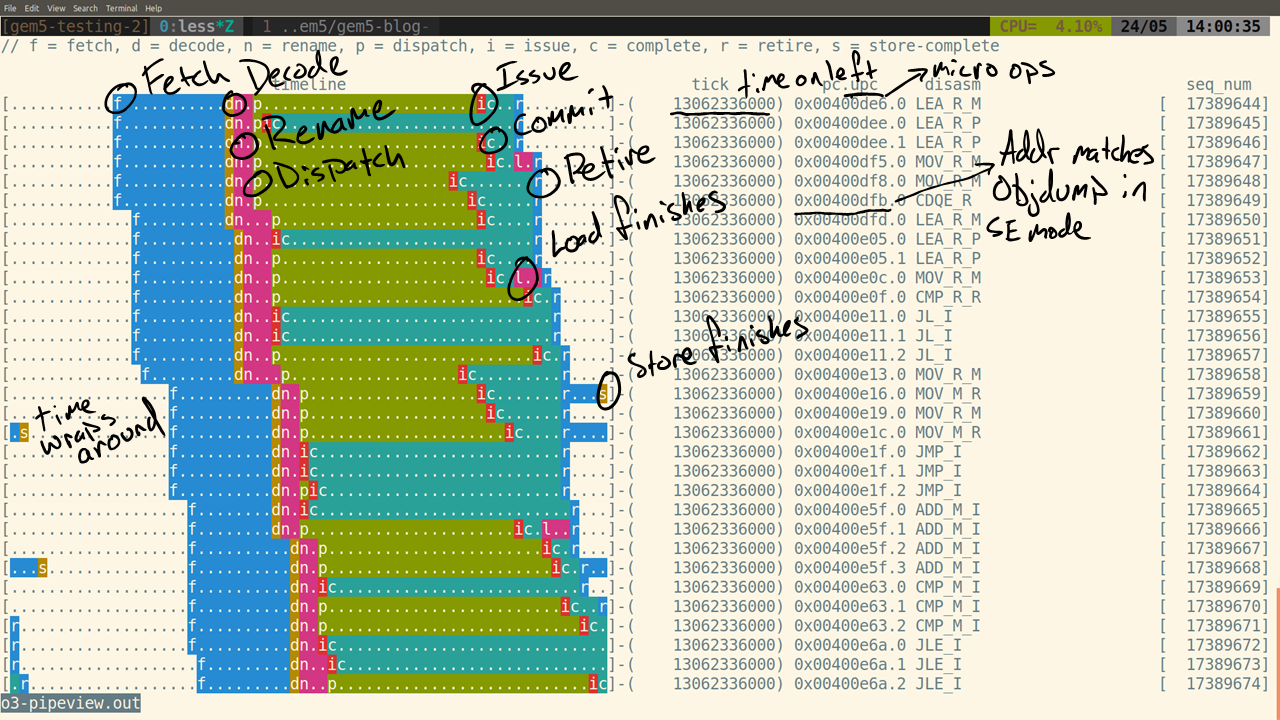
o3 pipeline view example
The above image details how to interpret the output from the pipeline viewer. Each . or = represents one cycle of time, which moves from left to right. The "tick" column shows the tick of the leftmost . or =. = is used to mark the instructions that were later squashed. The address of the instruction (and the micro-op number) as well as the disassembly is also shown. The sequence number can be ignored as it is always monotonically increasing and is the total order of every dynamic instruction. Finally, each stage of the O3 pipeline is shown with a different letter and color.
Digging deeper into Spectre
First, let's examine the actual instructions that are executed during the Spectre attack. The vulnerability is in the victim_function in spectre.c.
void victim_function(size_t x) {
  if (x < array1_size) {
    temp &= array2[array1[x] * 512];
  }
}
When this is compiled and then dumped with objdump, we get the following instructions that will be executed. Your code my be slightly different, especially the exact addresses of each instruction, depending on the version of the compiler and other system-specific configurations.
# NOTE: the movzbl below is MOVZX_B_R_M in gem5.
# it is implemented with the following microcode.
#    ld t1, seg, sib, disp, dataSize=1
#    zexti reg, t1, 7
#
000000000040105e <victim_function>:
  40105e:   55                      push   %rbp
  40105f:   48 89 e5                mov    %rsp,%rbp
  401062:   48 89 7d f8             mov    %rdi,-0x8(%rbp)
  401066:   8b 05 14 f0 2b 00       mov    0x2bf014(%rip),%eax # 6c0080 <array1_size> load array1_size (first time is always a miss)
  40106c:   89 c0                   mov    %eax,%eax
  40106e:   48 3b 45 f8             cmp    -0x8(%rbp),%rax  # if (x < array1_size) rax is array1_size, -8(%rbp) is x
  401072:   76 2b                   jbe    40109f <victim_function+0x41> # if (x < array1_size)
  401074:   48 8b 45 f8             mov    -0x8(%rbp),%rax # load x from the stack into rax
  401078:   48 05 a0 00 6c 00       add    $0x6c00a0,%rax  # calculate array1 offset (x+array1)
  40107e:   0f b6 00                movzbl (%rax),%eax # load array1[x]
  401081:   0f b6 c0                movzbl %al,%eax    # zero extend to 32 bits
  401084:   c1 e0 09                shl    $0x9,%eax   # multiply by 512
  401087:   48 98                   cltq               # sign-extend eax
  401089:   0f b6 90 80 1d 6c 00    movzbl 0x6c1d80(%rax),%edx  # load array2[array1[x]*512] **** This is the magic!
  401090:   0f b6 05 e9 0c 2e 00    movzbl 0x2e0ce9(%rip),%eax        # 6e1d80 <temp> Load temp.
  401097:   21 d0                   and    %edx,%eax
  401099:   88 05 e1 0c 2e 00       mov    %al,0x2e0ce1(%rip)        # 6e1d80 <temp>
  40109f:   5d                      pop    %rbp
  4010a0:   c3                      retq
Now, we can search for the instruction that we care about in the trace. In this case, we want to find a time where the movzbl at address 0x401089 is executed speculatively. When searching through the pipeline viewer (use \ in less), we're looking for a time where the load completes for the instruction at 0x401089 and it is later squashed (surrounded by =). An example is shown below.
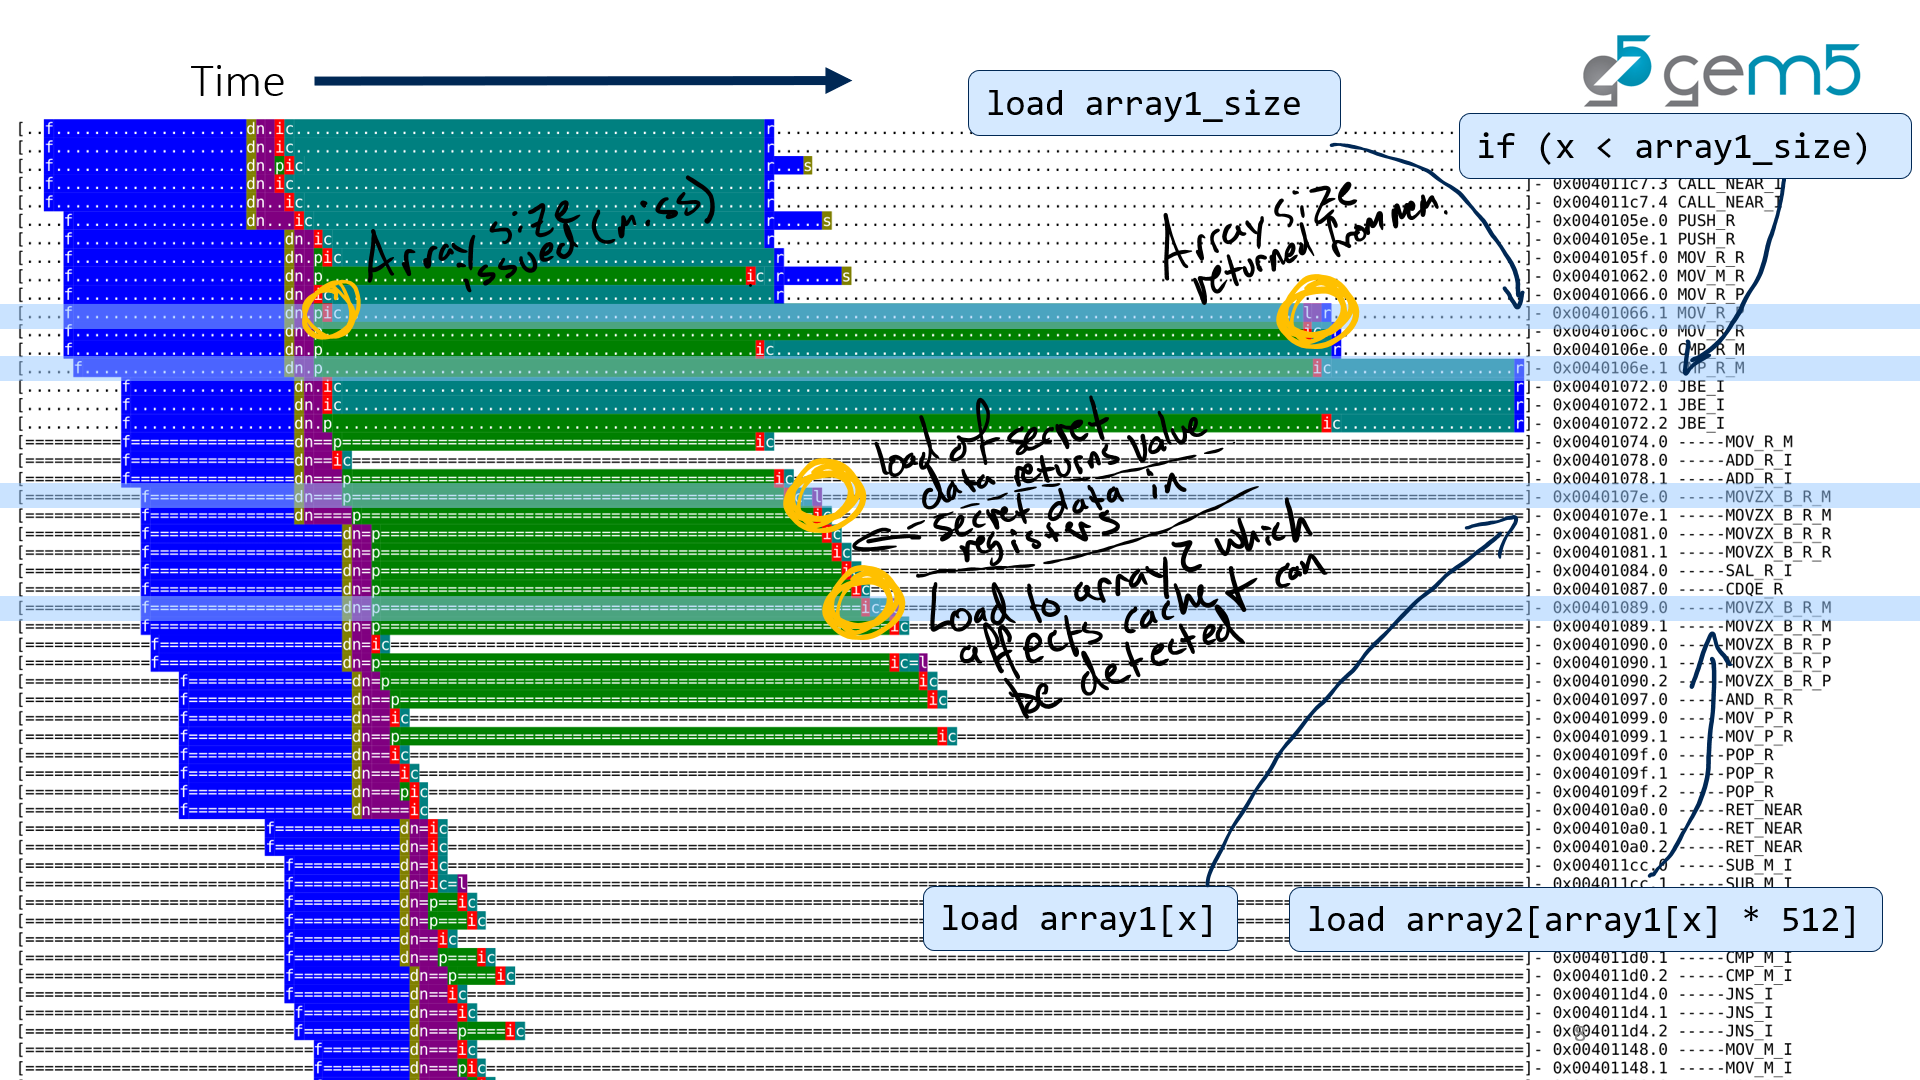
annotated O3 pipeline view of spectre
The image above is from my presentation at Hardware and Architectural Support for Security and Privacy (HASP) 2018.
What we see in this image is that the instruction at 0x401066 causes a cache miss (there is a long time between when the load is issued and the data is returned from memory). Since the load of array1_size was a cache miss, the jump at 0x401072 is speculated to be not taken (incorrectly). This causes the following instructions to be executed speculatively, and, eventually, squashed.
The key thing in this trace that is the Spectre vulnerability is that the load for the instruction at 0x40107e, which loads secret data happens during the mis-speculated instructions. Then, this data is loaded into the registers and operated on (instruction 0x401084). Finally, the load at address 0x401089 is executed and loads the value from memory that is dependent on the secret data loaded previously. Thus, we can later probe the cache to retrieve the secret data.
Effects of compilers
As previously mentioned, the specific compiler version and compiler options have a significant effect on the attack. Below are two traces, one from GCC 7.2 and one from clang 4.0.
GCC 7.2
void victim_function(size_t x) {
  400b2d:       55                      push   %rbp
  400b2e:       48 89 e5                mov    %rsp,%rbp
  400b31:       48 89 7d f8             mov    %rdi,-0x8(%rbp)
  if (x < array1_size) {
  400b35:       8b 05 c5 c5 2c 00       mov    0x2cc5c5(%rip),%eax        # 6cd100 <array1_size>
  400b3b:       89 c0                   mov    %eax,%eax
  400b3d:       48 39 45 f8             cmp    %rax,-0x8(%rbp)
  400b41:       73 34                   jae    400b77 <victim_function+0x4a>
    temp &= array2[array1[x] * 512];
  400b43:       48 8d 15 d6 c5 2c 00    lea    0x2cc5d6(%rip),%rdx        # 6cd120 <array1>
  400b4a:       48 8b 45 f8             mov    -0x8(%rbp),%rax
  400b4e:       48 01 d0                add    %rdx,%rax
  400b51:       0f b6 00                movzbl (%rax),%eax
  400b54:       0f b6 c0                movzbl %al,%eax
  400b57:       c1 e0 09                shl    $0x9,%eax
  400b5a:       48 63 d0                movslq %eax,%rdx
  400b5d:       48 8d 05 9c f6 2c 00    lea    0x2cf69c(%rip),%rax        # 6d0200 <array2>
  400b64:       0f b6 14 02             movzbl (%rdx,%rax,1),%edx
  400b68:       0f b6 05 91 e1 2c 00    movzbl 0x2ce191(%rip),%eax        # 6ced00 <temp>
  400b6f:       21 d0                   and    %edx,%eax
  400b71:       88 05 89 e1 2c 00       mov    %al,0x2ce189(%rip)        # 6ced00 <temp>
  }
}
  400b77:       90                      nop
  400b78:       5d                      pop    %rbp
  400b79:       c3                      retq
However, clang generates the following code.
void victim_function(size_t x) {
  400ac0:       55                      push   %rbp
  400ac1:       48 89 e5                mov    %rsp,%rbp
  400ac4:       48 89 7d f8             mov    %rdi,-0x8(%rbp)
  if (x < array1_size) {
  400ac8:       48 8b 7d f8             mov    -0x8(%rbp),%rdi
  400acc:       8b 04 25 90 c0 6c 00    mov    0x6cc090,%eax
  400ad3:       89 c1                   mov    %eax,%ecx
  400ad5:       48 39 cf                cmp    %rcx,%rdi
  400ad8:       0f 83 2f 00 00 00       jae    400b0d <victim_function+0x4d>
    temp &= array2[array1[x] * 512];
  400ade:       48 8b 45 f8             mov    -0x8(%rbp),%rax
  400ae2:       0f b6 0c 05 a0 c0 6c    movzbl 0x6cc0a0(,%rax,1),%ecx
  400ae9:       00
  400aea:       c1 e1 09                shl    $0x9,%ecx
  400aed:       48 63 c1                movslq %ecx,%rax
  400af0:       0f b6 0c 05 40 f2 6c    movzbl 0x6cf240(,%rax,1),%ecx
  400af7:       00
  400af8:       0f b6 14 25 50 dc 6c    movzbl 0x6cdc50,%edx
  400aff:       00
  400b00:       21 ca                   and    %ecx,%edx
  400b02:       40 88 d6                mov    %dl,%sil
  400b05:       40 88 34 25 50 dc 6c    mov    %sil,0x6cdc50
  400b0c:       00
  }
}
  400b0d:       5d                      pop    %rbp
  400b0e:       c3                      retq
  400b0f:       90                      nop
Interestingly, the clang-compiled spectre binary is not able to read the secret data! (At least not in gem5. It is able to read the secret data on my native machine.)
We can look into the two traces to see the difference between the clang version and the GCC version.
The main difference is that in the clang version, the load generated by the instruction at 0x400af0 never completes (and thus, must not have been issued to the memory system).
I'm not sure the exact cause of this difference. It could be that the instruction uses a different addressing mode (movzbl 0x6cf240(,%rax,1),%ecx in clang vs movzbl (%rdx,%rax,1),%edx in GCC). If you have ideas, please leave a comment!
Either way, minor differences in the code generated can have large impacts on the speculative execution!
Effects of branch predictor
When I was first playing around with Spectre and gem5, I ran into a problem where I could only sometimes get Spectre to "work" with the out of order CPU. After significant digging, I found that the branch predictor chosen makes a big difference to how quickly the vulnerability happens. The trace below (with the same code as GCC 4.8 above) shows what happens when using the tournament branch predictor.
Here, we see that the original branch misprediction comes much earlier than the jump instruction in victim_function that is at address 0x401072. Thus, by the time the load instructions in victim_function are executed, the ROB and load-store queue resources have been taken by other instructions and the rogue loads are not issued to memory. There are still a few times that the two loads are executed speculatively, but it is much more rare than with the TAGE predictor. When using the TAGE branch predictor, only the exact branch that the attacker wants to mispredict is mispredicted.
This interestingly shows that a "smarter" system is actually more vulnerable to speculation-based attacks!
Comments !